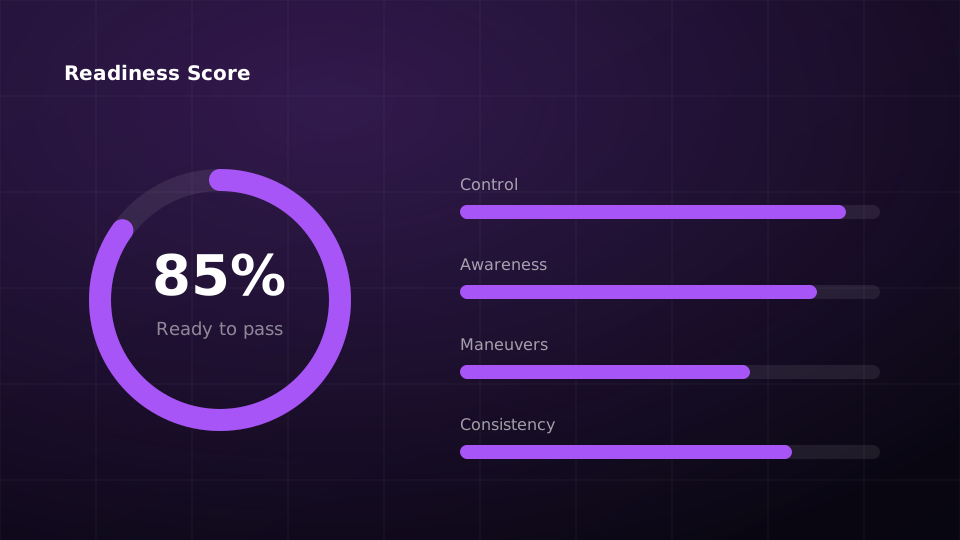
The data science behind 95% exam-readiness scoring
- Readiness is reduced to one calibrated score a learner and instructor can trust.
- The model weighs four signal families across the conditions each was practiced in.
- Partner schools have seen pass rates rise by an average of 14%.
Exam readiness sounds simple — is this learner ready to pass? In practice it’s one of the hardest questions in driver education. Toby Drive answers it with a single, trustworthy score, and behind that number sits a model trained on millions of real lesson signals.
01 Why one score is hard
Driving is multi-dimensional. A learner can be excellent at control yet hesitant at junctions, confident in daylight but uneasy at night. Reducing that to one honest number means weighing dozens of skills against the conditions each was practiced in.
The model doesn’t decide who passes. It gives instructors a clear, early signal so they can focus their time where it matters most.
02 The signals we use
Every lesson logged in INSUQ generates structured data. The most predictive signals fall into four families:
- Control — smoothness of steering, braking and acceleration.
- Awareness — observation, anticipation and hazard response.
- Maneuvers — parking, reversing and junction success rates.
- Consistency — how stable performance is across varied routes.
03 From signals to a score
We use a gradient-boosted model calibrated against real test outcomes, so a 95% readiness score genuinely corresponds to a 95% historical pass rate.